


If you combine enterprise network monitoring tools with industry best practices for network management, you’ll gain fuller visibility over your assets and establish a healthier network environment. Depending on your company’s security requirements and levels of risk, you can get advanced network monitoring features or just the basics with our picks for the top tools.
In this article, we take a look at the eight best network monitoring solutions available in 2025.
Ready1
Employees per Company Size
Micro (0-49), Small (50-249), Medium (250-999), Large (1,000-4,999), Enterprise (5,000+)
Small (50-249 Employees), Medium (250-999 Employees), Large (1,000-4,999 Employees), Enterprise (5,000+ Employees)
Small, Medium, Large, Enterprise
Features
Incident Management
Top network monitoring tools: Comparison table
We have a more detailed look at each product below, but if you’re looking to quickly compare these tools in a few key areas, here’s a comparison table of all the products we’ll cover:
| Software | ||||||
|---|---|---|---|---|---|---|
| Progress WhatsUp Gold | ||||||
| Cacti | ||||||
| Nagios | ||||||
| Zabbix | ||||||
| ManageEngine OpManager | ||||||
| Datadog | ||||||
| Paessler PRTG Network Monitor | ||||||
| Wireshark | No, |
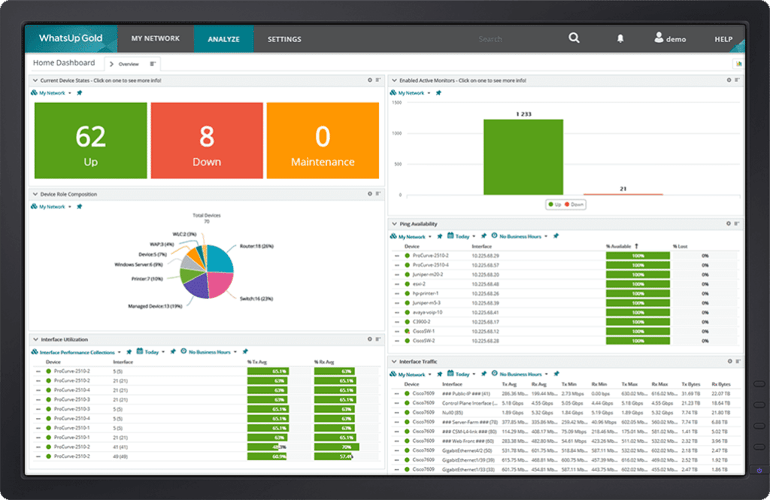
Progress WhatsUp Gold: Best overall
Progress’s WhatsUp Gold is an IT infrastructure monitoring solution that gives users full visibility into everything connected to their network. You’ll be able to see your servers, virtual machines, network devices, and cloud and wireless environments. This approach will help you make better diagnostic decisions when fixing network or component-specific problems.
This is an SNMP-based network monitoring solution that you can expand with different add-ons. A great benefit of this platform is that it’s easy to use. Thanks to its interactive map, you’ll easily get the information you need to evaluate the status of your devices.
Why I chose Progress WhatsUp Gold
I chose WhatsUp Gold because it offers a modular pricing system that lets companies pick and choose the extra features they need. I also like its modern UX and interactive network mapping, which helps companies build the right monitoring system for their specific needs.
Pricing
Progress WhatsUp Gold does disclose starting prices on its website, but you’ll need to contact the sales department for a more accurate quote. There are three paid plans in addition to the forever free edition:
- Free edition: $0 for up to 10 devices.
- Business: starts at $1169 for 50 devices.
- Enterprise: starts at $1,949 for 50 devices.
- Enterprise Plus: starts at $3,299 for 50 devices.
Features
Popular features of this platform include:
- Log management.
- Alerts.
- Configuration management.
- Cloud-based resources.
- Application performance monitoring.
- Wireless network management.
- Flowmon NPMD/NDR.
- Network performance monitoring.
- Network mapping.
Pros and cons
| Pros | Cons |
|---|---|
| It’s suitable for any business size or industry background. | The number of features may be overwhelming for some users. |
| The interface is user-friendly. | It may be complex to manage your notifications. |
| There are plenty of accessible and useful features. | It can be costly, depending on the plan you select. |
SEE: How to Create an Effective Cybersecurity Awareness Program (TechRepublic Premium)
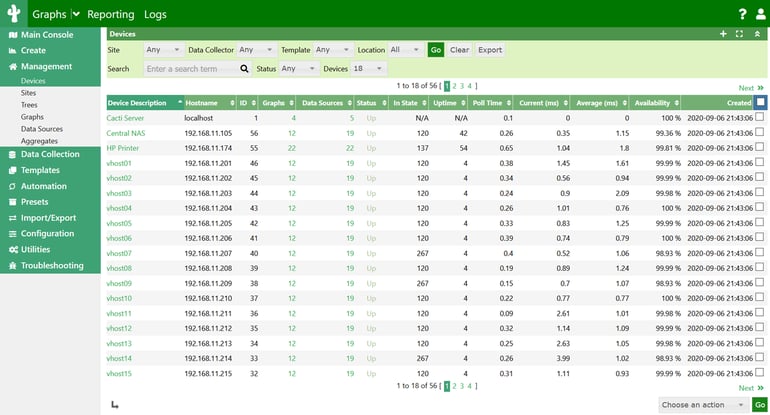
Cacti: Best bare bones option
![]()
Cacti is a monitoring and fault management framework that integrates with the Simple Network Management Protocol and is useful for making graphical representations of network traffic. While it’s built for statistical modeling, the tool is a good option for those with the technical chops to integrate their SNMP data. Cacti offers six built-in themes for you to customize your experience and has been translated into many languages.
Why I picked Cacti
Cacti is a free tool with the capabilities to provide the basic functions of network monitoring, provided that your team has staff that can understand statistical modeling and can connect and maintain the SNMP hook-up.
Pricing
Cacti is a forever free tool released under the GNU General Public License.
Features
Cacti is an advanced template-based solution that allows you to work with the following features:
- Device templates.
- Graphs and graph templates.
- Data source management.
- Profiles.
- Data polling and collection.
- Packaging.
- Discovery and automation.
- Different graph-viewing options.
- Plugins.
- Group and domain management.
- An intuitive dashboard.
Pros and cons
| Pros | Cons |
|---|---|
| It’s free. | Features are limited for many business use cases and requirements. |
| It’s RRDTool-based. | The user interface is simple; some users may find it dated. |
| The graphs are based on the SNMP protocol. |
SEE: Best Home Network Monitoring Options (TechRepublic Forums)
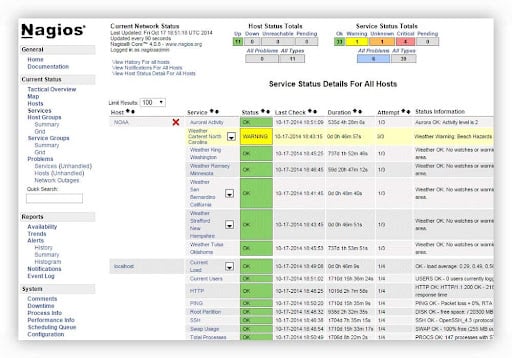
Nagios XI: Best for growing companies
![]()
Nagios is a networking monitoring software solution that is available in both open-source and commercial, enterprise-level versions. Users have full access to the source code, which provides them with the opportunity to customize their experience within the tool. Enterprise users of Nagios XI can benefit from features like multi-tenant architecture and APIs for extendable architecture.
Why I picked Nagios XI
Nagios XI comes in two editions that build upon the Nagios Core edition. Growing companies that plan to expand their networks can easily scale from the free and open-source Core edition to the enterprise edition. I think this is especially helpful for organizations that need multi-tenant capabilities.
Pricing
In addition to the free and open-source Nagios Core, Nagios XI also offers several different pricing plans to choose from:
- Free edition: Free forever for up to 7 devices or 100 nodes.
- Standard Edition: Flexible pricing starting at $2,495.
- Enterprise Edition: Flexible pricing starting at $4,490.
- Sitewide Edition: Contact sales for a custom pricing quote.
Features
Nagio’s most useful features include the following:
- Comprehensive monitoring solutions.
- Quick problem remediation.
- Proactive planning.
- Reporting tools and third-party add-ons.
- Multi-tenant capabilities.
- Extendable architecture.
Pros and cons
| Pros | Cons |
|---|---|
| Robust user community. | UI isn’t considered intuitive. |
| Free version and free demo are both available. | Plugins aren’t always straightforward to install. |
| Compatible with a variety of operating systems and network devices. | Complicated configuration process. |
SEE: The 8 Best Penetration Testing Tools for 2024 (TechRepublic)
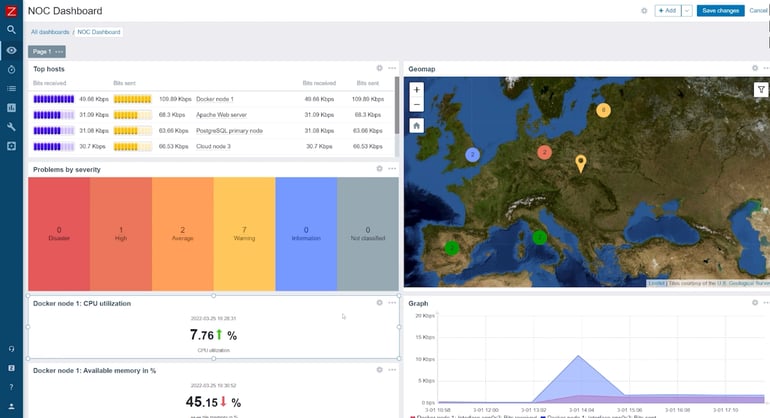
Zabbix: Best for device flexibility
![]()
Zabbix is a network monitoring and traffic analysis tool that is compatible with a variety of network protocols and devices operating within the same web console. Using this tool, you’ll be able to collect data and monitor your networks without having to open different tabs.
It’s important to note that Zabbix supports Hyper-V, VMware, and other virtualization hypervisors. Even though you can run this platform without an agent by setting the SNMP protocol, it’ll be easier to manage everything with an agent.
Why I picked Zabbix
Zabbix is flexible and extensible for nearly any type of integration or device. I believe this makes it ideal for companies with custom and wide-ranging monitoring needs.
Pricing
Zabbix is free and open-source software, but companies may need to contract with partners for implementation or support.
Features
You’ll get plenty of templates applied by default. Some of these include templates for HTTP, ICMP, SMTP, and IPMI protocols, as well as templates for Linux and Windows Server systems.
Other notable features of Zabbix include:
- Flexible metric collection.
- High-performance Zabbix agents.
- Agentless monitoring.
- Synthetic monitoring.
- Custom data collection methods.
- Data transformation.
- Machine learning and trend prediction.
- Auto-remediation.
Pros and cons
| Pros | Cons |
|---|---|
| It has a lot of useful features for large businesses. | It uses complex terminologies and must be set up manually. |
| It’s flexible. | The user interface isn’t the best. |
| It can send you alerts when a device or link is down. |
SEE: Risk Management Policy (TechRepublic Premium)
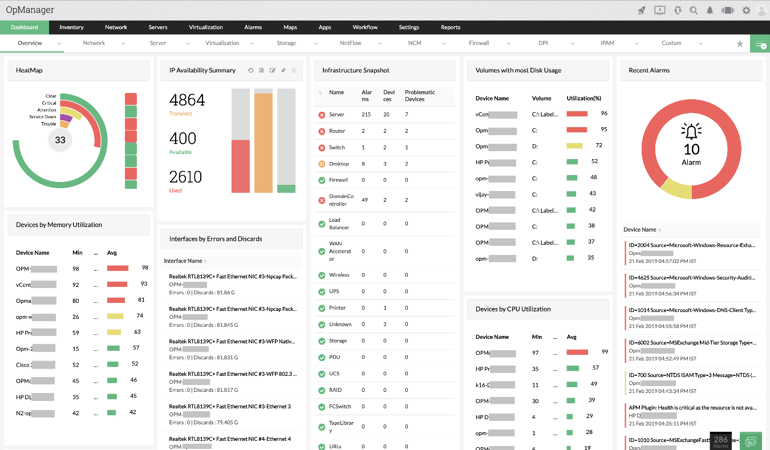
ManageEngine OpManager: Best for complex environments
![]()
ManageEngine OpManager is one of the most robust tools available for network monitoring today. Users often select this tool for its flexibility and ease of use. It gives them greater visibility into switches, firewalls, wireless LAN controllers, servers, storage devices, routers, and more.
If you select the Standard version of this product, you’ll get basic monitoring, custom dashboards, and notifications. Higher-tier plans give you extras like application-specific monitoring and advanced troubleshooting tools.
Why I chose ManageEngine OpManager
I chose ManageEngine OpManager because it’s a network monitoring software that can easily manage complex environments. I also appreciate the easy-to-use interface, which allows admins to quickly find the root of problems in a single space.
Pricing
Personalized pricing and packaging are available by user request. However, most users select one of the following three editions:
- Standard Edition: Starts at $245 for 25 devices.
- Professional Edition: Starts at $345 for 25 devices.
- Enterprise Edition: Starts at $4,595 for 250 devices.
Features
Here’s an overview of the features you’ll find in this network performance monitoring solution:
- Network and wireless network monitoring.
- WAN monitoring.
- Cisco ACI monitoring.
- Physical and virtual server monitoring.
- Storage monitoring.
- Distributed network monitoring.
- Network visualization.
- Fault management.
Pros and cons
| Pros | Cons |
|---|---|
| It’s easy to set up. | It’s not suited for small businesses. |
| The reports are detailed and highly visual. |
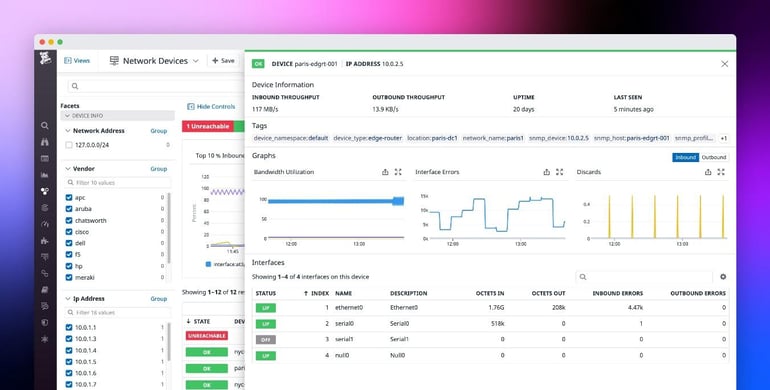
Datadog: Best for app monitoring
![]()
Datadog is an infrastructure and network monitoring tool that offers a wide range of products and features that cater to most business requirements. If you have complex infrastructure, applications, logs, or other components to consider in your network, this is one of the most versatile options in this market.
Why I chose Datadog
I chose Datadog because it’s a robust tool that can monitor a variety of networks, including infrastructure and app management. The variety of tools makes it ideal for SaaS and consumer-focused companies that need uptime monitoring and user analytics for their apps.
Pricing
Pricing for Datadog depends on which category of network monitoring your organization is most interested in. Users can choose from plans that focus on infrastructure monitoring to log management, network monitoring, and cloud security management. For users who are interested in the infrastructure plan group, which offers the most robust feature options, pricing breaks down into these three plans:
- Free: Starting at $0 for up to five hosts.
- Pro: Starting at $15 per host per month billed annually, or $18 per host per month billed monthly.
- Enterprise: Starting at $23 per host per month billed annually, or $27 per host per month billed monthly.
- DevSecOps Pro: Starting at $22 per host per month billed annually, or $27 per host per month billed monthly.
- DevSecOps Enterprise: Starting at $34 per host per month billed annually, or $41 per host per month billed monthly.
Features
This platform offers many useful features, like the following:
- SaaS and cloud provider compatibility.
- Automation tools.
- Monitoring tools.
- Source control.
- Integrations.
- App performance troubleshooting.
- Log analyzing and filtering.
Pros and cons
| Pros | Cons |
|---|---|
| It has plenty of features to track anything you want. | Some of the features are too complicated or technical for the average user to use well. |
| Support for a variety of infrastructure and application types. | |
| Highly configurable. |
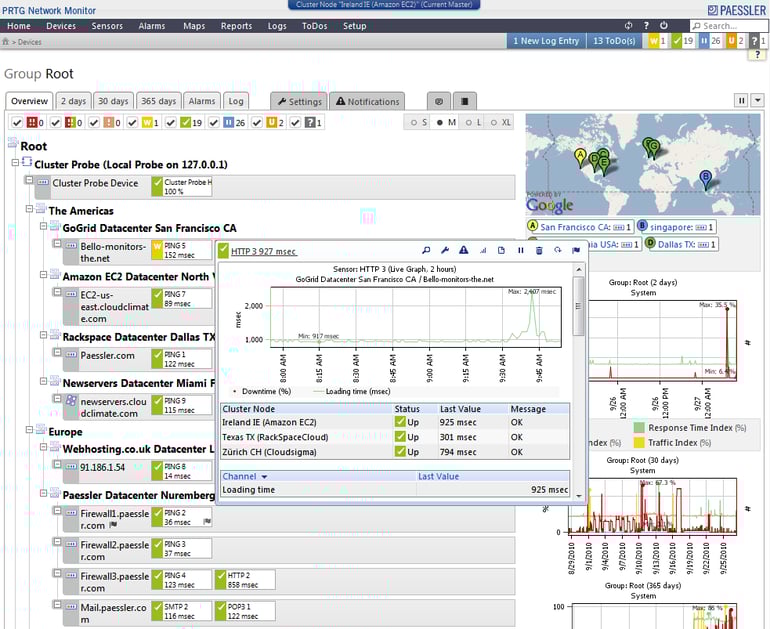
Paessler PRTG Network Monitor: Best for SMBs
Paessler offers standard-but-capable features that allow you to monitor every element of your network infrastructure. The main benefit of using this platform is that it doesn’t overwhelm you with overly complex features. Because this tool can be used to monitor up to 1,000 devices and services, it is best suited for SMBs.
Why I chose Paessler PRTG Network Monitor
I chose Paessler PRTG Network Monitor because the five different pricing plans provide excellent scalability. I also like that it provides full reporting modules, making a fully featured solution for Windows-only SMBs. However, the price is higher than some open-source options on this list, and it only supports WIndows, so it’s not suitable if you also use MacOS.
Pricing
PRTG Network Monitor is available in five different perpetual license options:
- PRTG 500: $2,159 per server license for monitoring up to 500 aspects, or around 50 devices.
- PRTG 1000: $3,899 per server license for monitoring up to 1,000 aspects, or around 100 devices.
- PRTG 2500: $8,099 per server license for monitoring up to 2,500 aspects, or around 250 devices.
- PRTG 5000: $14,199 per server license for monitoring up to 5,000 aspects, or around 500 devices.
- PRTG XL: $17,899 per server license for monitoring up to 10,000 aspects, or around 1,000 devices.
Features
The best features you’ll get from Paessler include:
- Reporting modules.
- SNMP utilization.
- Graphs.
- Mobility.
- ITOps dashboards.
- Network monitoring.
- Notifications.
- Quick sensor discovery.
- Ping testing.
- Remote probe feature.
Pros and cons
| Pros | Cons |
|---|---|
| It’s user-friendly. | It’s not as affordable as other options. |
| It’s scalable. | It only supports Windows. |
| It has all the features SMBs need for network monitoring. | It may not have the capacity to manage larger and more complex enterprise environments. |
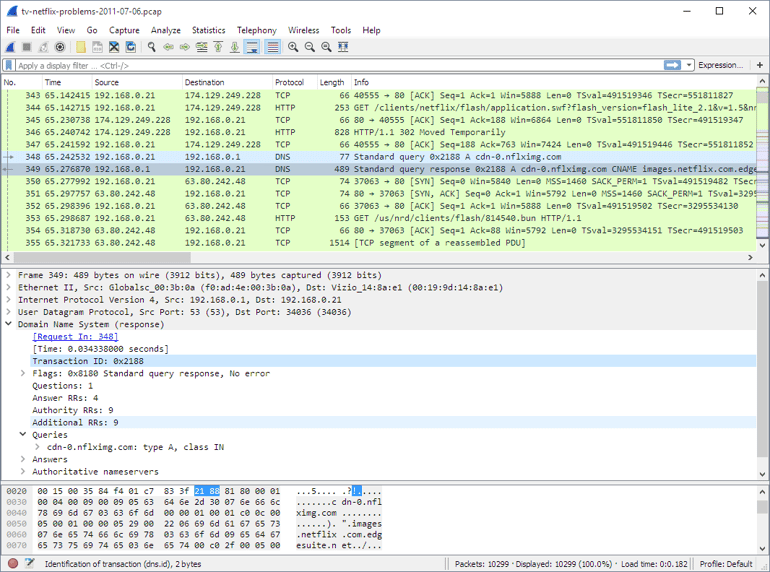
Wireshark: Best for multi-platform companies
![]()
Wireshark is a popular network traffic monitoring tool that works with most known protocols. As free and open-source software that supports nearly any operating system, it’s ideal for companies with a variety of business arms that need real-time analysis.
Why I chose Wireshark
I chose Wireshark because it’s a highly popular open-source software with a large community that offers many support resources, including education, a conference, and documentation. I also appreciate that it’s available for many protocols and operating systems, which is ideal for high-growth companies that will need to extend their monitoring.
Pricing
Wireshark is a free, open-source network monitoring solution released under the GNU General Public License version 2.
Features
Wireshark is known for the following features:
- Deep protocol inspection capabilities.
- Live capture and offline analysis.
- Rich VoIP analysis.
- Decryption support for many platforms.
- Support for many capture file formats.
- Powerful display filters.
- Three-pane packet browser.
Pros and cons
| Pros | Cons |
|---|---|
| It’s user-friendly. | It’s not as affordable as other options. |
| It’s scalable. | It only supports Windows. |
| It has all the features SMBs need for network monitoring. | It may not have the capacity to manage larger and more complex enterprise environments. |
What are the key features of network monitoring software?
There are dozens of different monitoring tools you can find online, but how can you make sure you’ve found the right one for your business? As a starting point, look for solutions that include these key features and capabilities:
- Real-time monitoring.
- Traffic analysis.
- Fault detection and alerting.
- Performance analysis and bandwidth usage.
- Customizable dashboards and reports.
- Remote monitoring capabilities.
Some products may have all of these features, whereas others may just have a few. It will be important for your team to determine which features are non-negotiable.
Factors to consider when choosing your next network monitoring tool
Not all tools are a one-size-fits-all solution. You must consider your needs and goals as a company if you truly want to choose the perfect network monitoring product and hopefully save money in the process.
Take your time when thinking about the particularities of your networking environment and the type of attention it requires. From there, you can select a product that’s a good fit for your business size, team expertise, security and compliance requirements, and much more.
Here are some factors you should keep in mind when choosing network monitoring tools:
- Your organization’s scalability requirements and the current size of your network.
- Your team’s in-house technical expertise and ease-of-use requirements.
- Integration with other IT management tools.
- Cost and licensing options.
- Vendor reputation and support.
Open-source vs commercial network monitoring solutions
Open-source software is free, which is probably its best feature. Users don’t have to closely partner with or meet vendors to access, configure, and customize these tools to their liking. Open-source platforms also often receive support from their communities, meaning you’ll get regular updates and access to a forum where you can share your concerns with other people.
Unfortunately, since open-source platforms are less regulated, you may experience more problems or bugs while using this type of tool. Moreover, you will be responsible for fixing these problems most of the time.
Open-source updates are provided by volunteers, so there’s no set schedule for receiving them. This may be a setback for those who are looking for updated tools.
In contrast, commercial solutions offer users stability and maturity with standardized products. However, these products usually come with a higher price tag and may have greater limitations placed on user-level customizations.
Which one is right for your organization?
Does your team have people willing to deal with the volatility of open-source software? If it does, then you can save some money and select an open-source network monitoring solution.
On the other hand, if you have the budget and don’t want to worry too much about quality or stability, commercial network management tools will be a better fit. Regardless of which one you use, if you use your tool alongside IT network monitoring best practices, you’ll achieve consistent results that improve your network as a whole.
Methodology
In my search for the best network monitoring tools, I consulted product documentation and user reviews. I considered features such as different types of monitoring, device templates, graph templates and viewing options, data source management, and plug-ins. I also weighed other factors, such as pricing, user interface design, customer support resources, automations, and reporting.
Frequently asked questions (FAQs)
What are network performance monitoring tools?
Network performance monitoring tools collect data for network devices, then display it all in consolidated visualizations. Some of the data gathered by network performance monitoring tools include devices, network flow data, and packet data. Network monitoring tools don’t just report on the health of the network; they can also be used for troubleshooting and optimizing to improve performance.
What is the most widely used network monitoring and management protocol?
Simple Network Management Protocol is the most widely used network monitoring and management tool. SNMP is an application layer protocol that collects data on network devices and their status changes. Other common network monitoring protocols include the Internet Control Message Protocol, the Cisco Discovery Protocol, and the Link Layer Discovery Protocol.
What is the difference between network management and network monitoring?
Network management is a broad category that encompasses many different kinds of tools that NetOps teams use to create and maintain a strong, healthy network. Network monitoring is a specific type of network management that involves collecting data from network devices and then creating visual representations of that data. This network monitoring data is usually consolidated into a single dashboard so the NetOps teams can get an overview of the network status and performance in one place.
This article was published in October 2024. It was updated by Luis Millares in July 2025.
Read the full article here